Introduction to VIS30K:
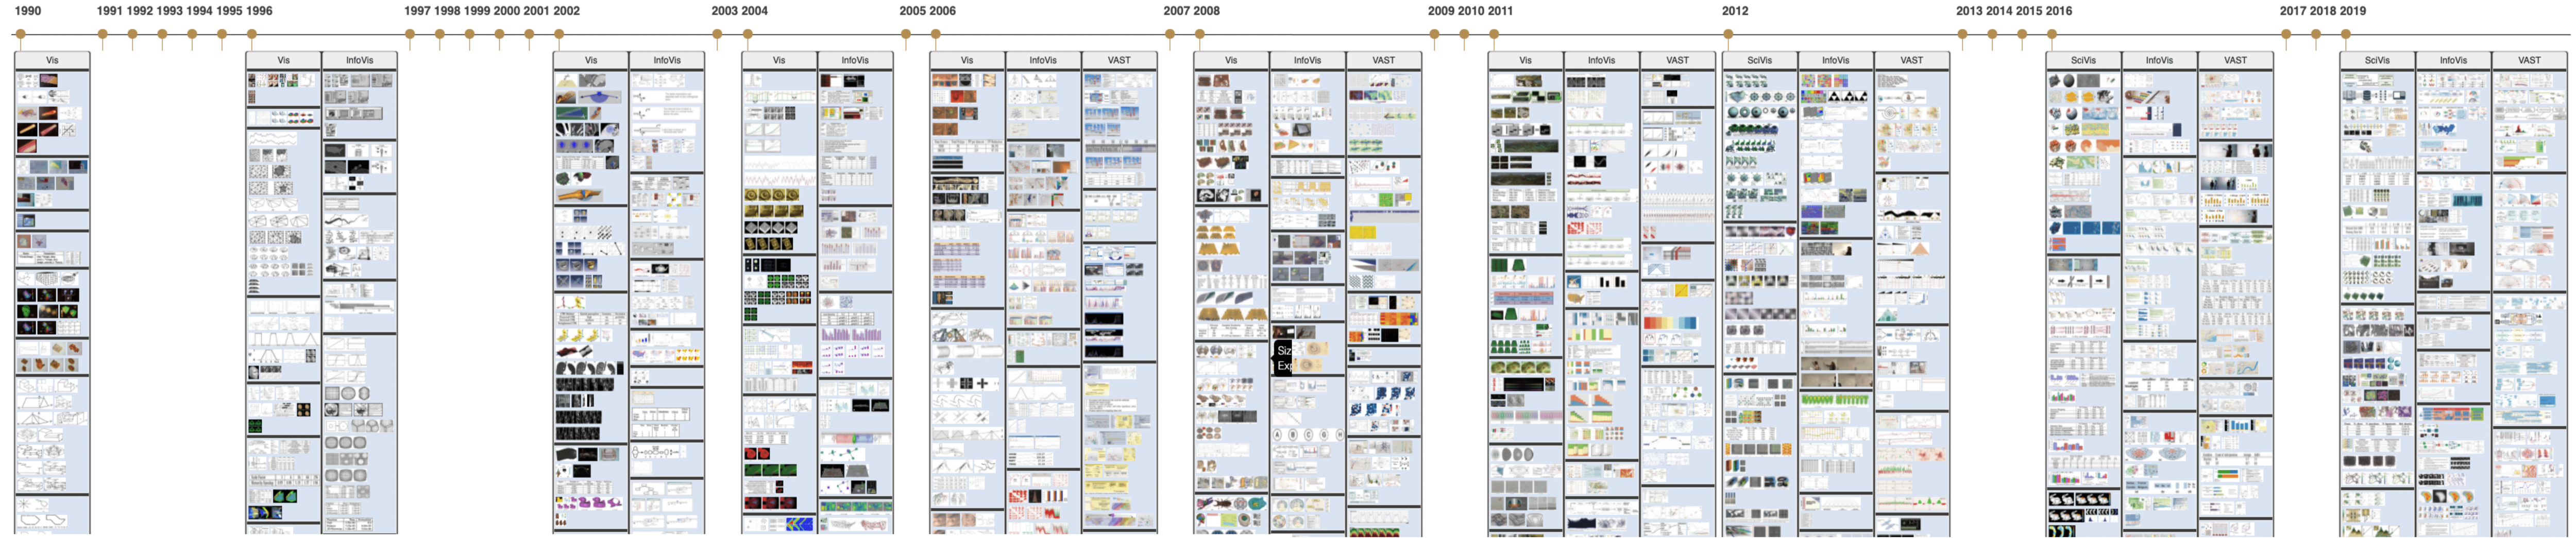
VIS30K is a collection of 31,481 images including every figure and table for 30 years spanning each track of the IEEE Visualization conference series (Vis, SciVis, InfoVis, and VAST).
Here is a timeline view of selected images of the entire 30 years IEEE Visualization conference showing the diverse and budding research work.
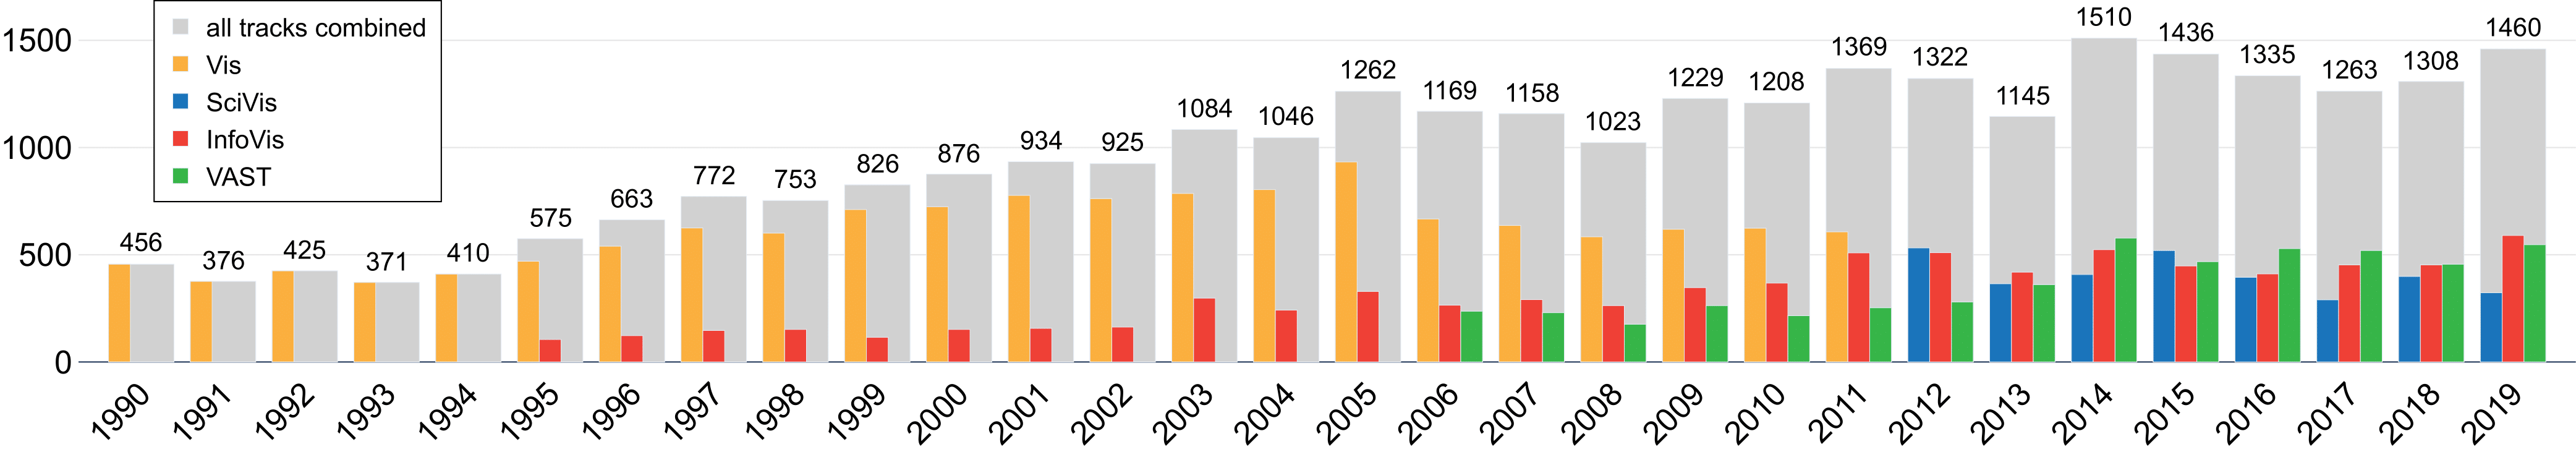
How are the images distributed over the years?
Total # of images (figures and tables), by year.
Average # of images (figures and tables) per page, by year.
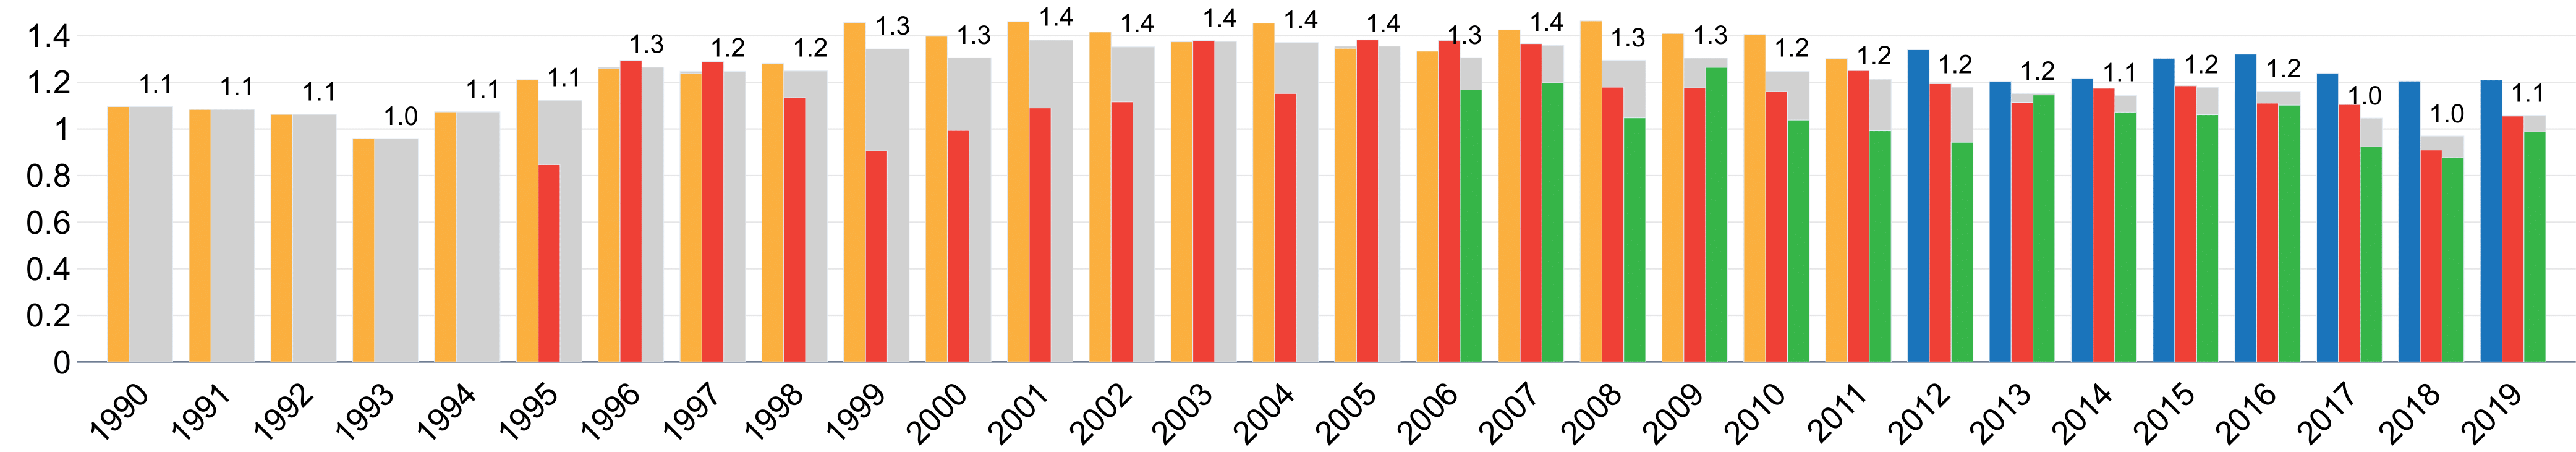
Average # of images (figures and tables) per page, by year.
What image (figure and table) data can you find here?
Images from every year of the IEEE VIS conferences:- VAST: 2006-2020
- InfoVis: 1995-2020
- Vis: 1990-2013
- SciVis: 2012-2020
What Data are Released for Reproducible Research?
- 31,481 images in VIS30K stored in IEEE dataport.- The meta data stored in google spread sheet.
- 10K Training and 3K validation datasets used in our CNN algorithms
- The image corpus and the text corpus for pseudo paper generation.
* For source code, please contact Prof. Jian Chen at chen.8028@osu.edu.
How to extract images automatically?
We used a CNN-based solution and end-to-end framework to extract figures and tables in research paper pages. The main idea behind our approach is to train a CNN with synthesized dummy papers, created with existing visualization image corpora. Equipped with the resulting training set creation, we then automatically extracted figures from paper pages. We have used Faster-RCNN and YOLOv3 to reduce the subsequent human effort. Please try our pre-trained model here.How to cite this work?
For dataset, please cite:Jian Chen, Meng Ling, Rui Li, Petra Isenberg, Tobias Isenberg, Michael Sedlmair, Torsten Möller, Robert S. Laramee, Han-Wei Shen, Katharina Wünsche, and Qiru Wang. VIS30K: A Collection of Figures and Tables from IEEE Visualization Conference Publications. IEEE Transactions on Visualization and Computer Graphics (2021).